React Native apps make network calls through fetch, Axios, or native modules — all of which ultimately send standard HTTPS requests. That means you can debug them by capturing the device's traffic and seeing exactly what your app sent and what the server returned. This guide walks through inspecting React Native network requests on a real device.
React Native gives you a familiar fetch and Axios API, but a production app routes far more than your own calls over the network: analytics, crash reporting, push registration, and any native module that talks to a backend. When a screen fails to load or an action silently does nothing, the quickest path to the cause is to see precisely what the device sent and what it got back — not what your JavaScript thinks happened.
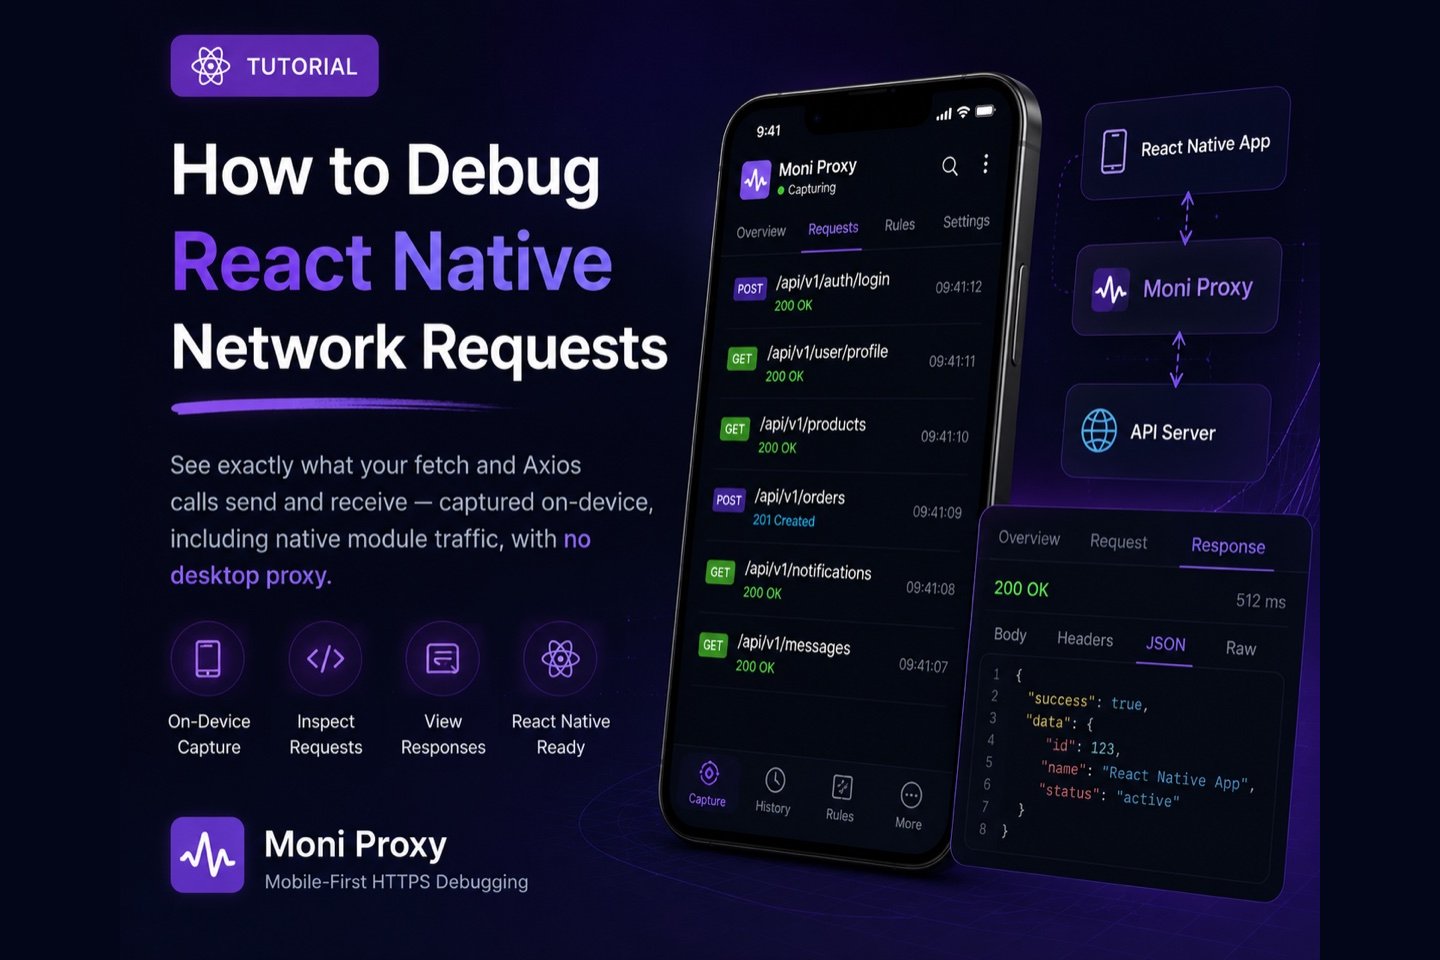
Why Capture on the Device?
In-app network loggers and remote debuggers are handy, but they only show what your JavaScript layer sees. Capturing on the device with Moni Proxy shows the real wire traffic — including requests from native modules and third-party SDKs — and works the same way on iOS and Android. Because it captures at the network layer, it reflects the request after any Axios interceptor or polyfill has transformed it, which is often where subtle bugs hide.
- API debugging: inspect the exact request and response for any
fetchor Axios call. - Auth troubleshooting: confirm tokens and headers are attached as expected.
- Backend issues: read decrypted responses to isolate client vs server bugs.
- SDK auditing: see what bundled native SDKs send over the network.
Options for Debugging React Native Traffic
- Flipper / network inspector: useful in development, but tied to a desktop tool and your JS network stack.
- Desktop proxy (Charles/Proxyman): powerful, but routes the device through a computer and needs a CA install plus a shared network.
- On-device capture (Moni Proxy): captures the whole app's HTTPS traffic on a real device, with no desktop setup.
Each has a place. For tight inner-loop work on your own JavaScript calls, an in-app logger is quick. When you need to verify the actual bytes on the wire — especially for release builds, native module traffic, or bugs that only reproduce on a real device on cellular — on-device capture is the most reliable option because it does not depend on a debugger being attached or a particular network setup.
Step-by-Step
1. Install and set up Moni Proxy
Install Moni Proxy on your test device and finish the one-time certificate trust wizard to enable on-device HTTPS decryption.
2. Start capturing and run your app
Tap Start, then open your React Native app and trigger the requests you want to inspect.
3. Inspect requests and responses
Open any entry to read the full request — URL, method, headers, query params, body — and the decrypted response with pretty-printed JSON. Common React Native bugs surface here: a wrong base URL from an env config, a missing auth header, or a body that was stringified incorrectly.
4. Mock and rewrite responses
Set up a rule to mock a response, rewrite a field, or replay an edited request, so you can test error handling, empty states, and slow networks without backend changes.
Common React Native Networking Bugs This Catches
Capturing the real wire traffic quickly turns ambiguous failures into concrete fixes. Common cases in React Native apps include:
- Wrong base URL per environment. An env file or build config sends requests to the wrong host. The captured request shows the exact URL.
- Missing or stale auth headers. An Axios interceptor or token refresh did not run, so requests go out unauthenticated. The header list confirms it.
- Body serialized incorrectly. An object stringified the wrong way, or the wrong
Content-Type, shows up immediately in the request detail. - Unexpected response shape. Reading the decrypted response next to your TypeScript types reveals mismatches that cause silent parsing failures.
- Native module traffic. Requests from a native SDK that your JS layer never sees still appear in the on-device capture.
On-Device Capture vs Flipper and JS Loggers
Flipper's network plugin and in-app loggers are convenient during development, but they only observe the JavaScript networking layer and are tied to a desktop tooling session. On-device capture works at the network layer on a real device, so it sees the full set of HTTPS requests — including native modules and SDKs — without a desktop debugger attached. Use JS-level logging for fast inner-loop work, and on-device capture when you need the ground truth of what the device actually sent.
A Note on Certificate Pinning
If your app pins certificates (for example via a TrustKit-based native module), pinned connections will not be decryptable by design. Disable pinning in debug builds for apps you control; production pinned traffic stays opaque, which is intended.
Tips for Faster React Native Debugging
- Keep sessions short. Start capture, trigger the failing action, stop. Focused captures are easier to read.
- Filter by your API host to skip analytics, ads, and image traffic.
- Diff working vs broken. Capture a passing and a failing request together; the difference usually is the bug.
- Test on both platforms. iOS and Android can behave differently for the same JS — capture on each when a bug is platform-specific.
- Save request/response into the ticket so the fix can be verified.
Conclusion
On-device capture gives you the complete picture of your React Native app's network behavior — fetch, Axios, and native modules — on a real iOS or Android device, with no desktop proxy. Use it alongside your in-app logging whenever you need to verify what actually went over the wire, and your debugging loop gets noticeably tighter.
Frequently Asked Questions
How do I debug network requests in React Native?
Capture the device's HTTPS traffic with Moni Proxy. fetch, Axios, and native module requests are all standard HTTPS, so each call is captured on-device with full headers and decrypted body — no desktop proxy needed, unless the app pins certificates.
Can I use this instead of Flipper?
It complements Flipper. Flipper is a desktop development tool tied to your JS stack; Moni Proxy captures the real wire traffic for the whole app on a real device, including native modules and SDKs.